Count-based and predictive word models for exploring DeReKo
Introduction
Distributional semantics is concerned with analysing language use based on the distributional properties of words derived from large corpora. In this tutorial we describe DeReKoVecs (Fankhauser, Kupietz 2017), a visualization of distributional word properties derived from the German Reference Corpus comprising over 50.6 Billion tokens of written contemporary German. DeReKoVecs represents the syntagmatic context of words in a window of five words to the left and to the right \(w_{-5}\ldots w_{-1}\,w\,w_1\ldots w_5\) as vectors. These vectors are either count-based or predictive. The count-based models are computed by various association measures based on (co-occurrence) frequencies in the corpus (for an overview see e.g. Evert 2008). The predictive models are trained using structured skipgrams (Ling et al. 2015), an extension of word2vec (Mikolov et al. 2013) that represents the individual positions in the syntagmatic context of a word separately, rather than lumping them together into a bag of words.
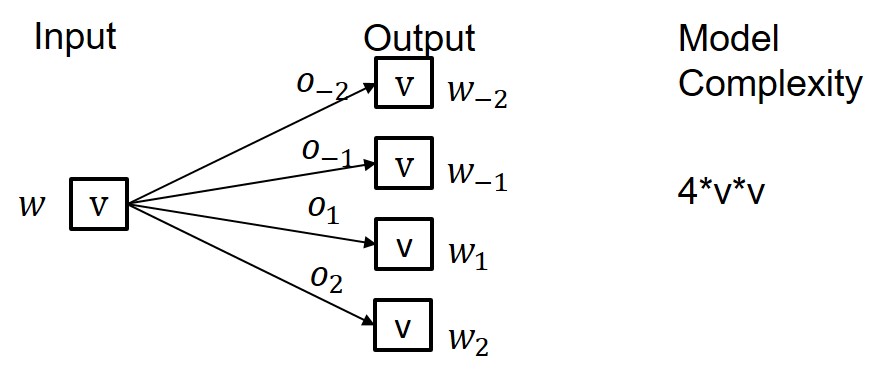
Figures 1 and 2 compare count-based and predictive models for a word
\(w\) in its left/right syntagmatic context with collocates
\(w_{-2}\,w_{-1}\,\_\,w_1\,w_2\). The count-based model represents
each pair \(w_i\,w\) individually by some association measure \(o_i\)
(see below). With a vocabulary size of \(v\) (the number of different
words, aka types) this leads to a very high dimensional model with
order \(O(v^2)\) parameters, where each word is represented by a
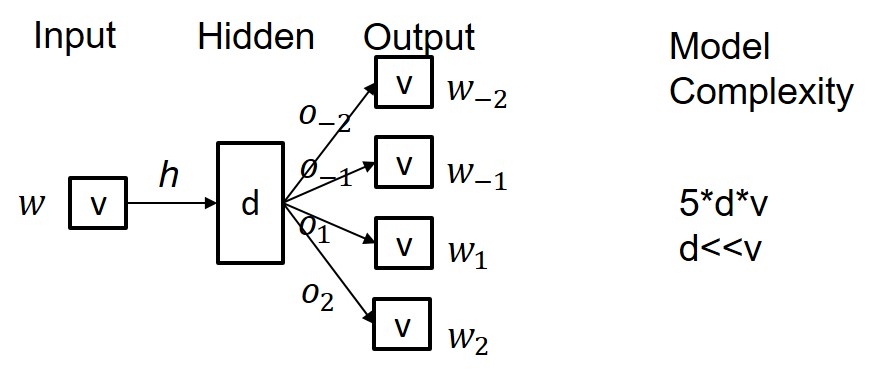
sparse vector of size \(4*v\). In contrast, the predictive model
introduces a hidden layer \(h\) of size \(d\). \(d\) is typically in
the range of 50 to 300 and thus much smaller than \(v\), which in the
case of DeReKo ranges in the millions. Each word can thereby be
represented by a much smaller vector of size \(d\), also called its
word embedding. Importantly, estimates of the association strength
between \(w\) and its left and right collocates can still be gained
via its output activations1
.
Count-based models and predictive models complement each other. Count-based models excel at representing all actually occurring, possibly polysemous usages, but they just memorize and do not generalize to other possible usages. In particular, they can fail to adequately represent low frequency words and collocations for which there simply do not exist enough examples. Predictive models generalize by means of dimensionality reduction in the hidden layer and thus can also predict unseen but meaningful usages, but they typically only represent the dominant, usually literal usage2. For the DeReKoVecs visualization we thus support and compare both models.
Both models support the analysis of word use along the paradigmatic and the syntagmatic axis. Paradigmatically related words, such as synonyms or (co-)hyponyms, which occur in similar syntagmatic contexts, can be identified by determining the similarity (usually cosine similarity) between their vectors, which are, by construction, a representation of their syntagmatic contexts. See, for example, the nearest paradigmatic neighbours of Wort (word) in DeReKoVecs under tab Paradigmatic (t-SNE). Syntagmatically related words, which occur close to each other more often than expected, are represented by their direct or computed association strength, as exemplified for Wort in the tab Syntagmatic.
A guided tour
DeReKoVecs provides a simple search form, some options, and three tabs for presenting the results.
The search form accepts
- Single words, which retrieve paradigmatic and syntagmatic neighbours for the given word: Arzt.
- Words separated by space, which retrieves near neighbours of the midpoint between their vectors to contrast their usage: Arzt Ärztin.
- Words separted by |, which retrieves the union of their near neighbours for an alternative contrastive analysis: Flüchtlinge|Geflüchtete.
The options allow to fine tune options such as frequency cutoff, maximum number of (paradigmatic) neighbours, or number of iterations for the self organizing map (see below). The default values for these should usually be ok.
The three result tabs give two alternative visualizations for the paradigmatic neighbourhood of the given words, and one, which allows to compare their count-based and predictive syntagmatic neighbourhood:
- Paradigmatic (t-SNE) maps the 200 dimensional embedded word vectors to two dimensions by means of t-distributed stochastic neighbourhood embedding (Maaten, Hinton 2008), in such a way that near neighbours in the higher dimension stay near to each other in two dimensions. Especially for contrastive analysis this allows to get a quick understanding of whether and to what extent the contrasted words indeed cluster into individual neighbourhoods. Moreover it provides a sorted list of the nearst neighbours, which can be clicked for exploring their respective neighbourhoods.
- Paradigmatic (SOM) clusters the paradigmatic neighbours into a 6 by 6 grid by means of selforganizing maps. This is in particular useful for identifying finer grained subclusters of near neighbours.
- Syntagmatic allows to compare the predictive (left)
with the count-based (right) syntagmatic neighbours.
For the predictive table the following columns are supported:- \(w'\) visualizes the actual position of the significant (+) syntagmatic neighbours, depending on the chosen aggregation of individual association strengths. Clicking on the individual positions generates a query to DeReKo via KorAP (requires registration) for the given pair of word and collocate at this position.
- \(max(a)\) takes the maximum association strength over the entire window.
- \(<a>\) takes the average association strength over the window, which consists of those positions that maximize the average (autofocus window).
- \(\sum a/\sum w'\) gives the sum of association strengths for the given word normalized by the total association strength of all words, again restricted to positions in the autofocus window, maximizing this measure. This is the default ordering, which usually yields sensible results.
- \(\perp(a/c)\) normalizes each association strength by the total association strength at each position, and then aggregates them via the conorm \(conorm(a,b)=a+b-ab\) for all positions in the autofocus window. This measure, by construction tends to select most positions for autofocus.
- \(\sum a/\sum w\) is like \(\sum a/\sum w'\) but over the entire window, without autofocus restriction.
- The final column gives the actual collocate.
More Visualizations
The following other visualizations based on distributional word models are available at the IDS:- The co-occurrence database CCDB provides a number of visualizations based on count-based co-occurrence profiles.
- Domain Specific Embeddings for DeReKo provide visualizations of predictive models differentiated by the 11 top-level domains in DeReKo + wikipedia.
- Diachronic Embeddings, Version 1 and Diachronic Embeddings, Version 2 provide visualizations for various diachronic corpora.
Footnotes
- More specifically, the output activations approximate the shifted pointwise mutual information. \(SPMI(w,w_i)=log(\frac{p(w,w_i)}{p(w)p(w_i)})-log(k)\), with \(k\) the number of negative samples used during training (see Levy and Goldberg 2014). Pointwise mutual information is one of the count-based collocation measures in DeReKoVecs.
- This focus on the dominant usage may be one of the main reasons for the relative success of predictive models as opposed to count-based models for lexical semantics tasks observed in Baroni et al. 2014, as these tasks tend to focus on dominant semantics.
Contact
- Peter Fankhauser. fankhauser at ids.mannheim.de
- Marc Kupietz. kupietz at ids.mannheim.de
Disclaimer
DeReKoVecs is an experimental platform. This tutorial may change along with changes to DeReKoVecs.
Acknowledgement
This tutorial and visualization have been partially funded by the CLARIAH-DE project.
References
- Baroni, M., Geogiana, D., Kruszewksi, G. (2014). Don't count, predict! A systematic comparison of context-counting vs. context-predicting semantic vectors. In: Proceedings of the 52nd Annual Meeting of the Association for Computational Linguistics (Volume 1: Long Papers), pp. 238-247, June 2014, Baltimore, Maryland, Association for Computational Linguistics doi: 10.3115/v1/P14-1023
- Evert, S. (2008). Corpora and collocations. In A. Lüdeling and M. Kytö (eds.), Corpus Linguistics. An International Handbook, article 58, pages 1212-1248. Mouton de Gruyter, Berlin.
- Fankhauser, P., Kupietz, M. (2017). Visualizing Language Change in a Corpus of Contemporary German. Corpus Linguistics Conference 2017. url: http://nbn-resolving.de/urn:nbn:de:bsz:mh39-91174.
- Levy, O., Goldberg, Y. (2014). Neural Word Embedding as Implicit Matrix Factorization. In: Advances in Neural Information Processing Systems (NIPS 2014), Vol. 24, 2014. url: https://proceedings.neurips.cc/paper/2014/file/feab05aa91085b7a8012516bc3533958-Paper.pdf.
- Ling, W., Dyer, C., Black, A., & Trancoso, I. (2015). Two/too simple adaptations of word2vec for syntax problems. In Proc. of NAACL.
- Van der Maaten, L. & Hinton, G. (2008). Visualizing Data using t-SNE. In Journal of Machine Learning Research 1, 1-48.
- Mikolov, T., Sutskever, I., Chen, K., Corrado, G. S., Dean, J. (2013). Distributed representations of words and phrases and their compositionality. In Proceedings of NIPS 2013, 3111–3119.